Chapter 6b – The Earth’s Heating and Ventilation System
By Michael Belsick
Clouds
Two of the most important and least understood elements in climate studies are the effects of clouds and aerosols. (Aerosols are minute solid and liquid matter such as smoke particles from fires or ash from volcanos, ocean spray, or microscopic specks of wind-blown soil; not the layman’s definition of something sprayed from a can or bottle like hairspray.) All cloud droplets have a speck of dirt, dust, or salt crystal at their core. Without aerosol particles, there would be no clouds. Two clouds having identical altitudes, thickness and water content can have very different effects on the climate due to the particular aerosol(s) content. The type of aerosol can also affect the cloud albedo, which affects the reflectivity of solar radiation. Generally, low thick clouds primarily reflect solar radiation and cool the Earth surface. High thin clouds are primarily transparent to incoming solar radiation; at the same time, they trap some of the outgoing infrared radiation emitted by the Earth thereby warming the surface.
The size of the cloud droplet that makes up the clouds resulting from the properties of the particular aerosol(s) has a huge impact on the reflection ability (albedo) and precipitation. Fewer aerosols (cleaner air), results in more droplets per aerosol particle such that each droplet contains more water. This produces dark clouds with heavy droplets that precipitate (rain) and therefore are shorter lasting and have relatively low albedo. More aerosols (higher polluted air) have the opposite effect. They have fewer water droplets per aerosol particle resulting in larger, brighter more reflective clouds (high albedo) that are longer lasting since they do not produce rain.
Clouds contribute more (25%) to the greenhouse effect than CO2 (20%). Of the total amount of CO2, only 5% is human caused, so 1% of the greenhouse gas is attributed to humans, or clouds contribute 25 times more than human caused CO2!
Here are some quotes by some climate scientists:
-
- Vahrenholt and Luning: “Whatever controls the clouds, rules the climate.”
- Voiland: “Just a 5% increase in cloud reflectivity could compensate for the entire increase in greenhouse gases from the modern industrial era in the global average.”
- Plimer: “A 1% change in cloudiness could account for all 20th century warming.”
- R John Holdren (President Obama’s science advisor): “…a mere one percent increase in cloud cover would decrease a surface temperature by 0.8 degree C (1.4 degree F).”
The bottom line is that clouds are generally understood but it is difficult to write a computer program for clouds unless one can calculate the aerosol component for each cloud. As such, many climate scientists ignore clouds and focus only on CO2 concentrations because that is much easier.
The Oceans
Figure 19 shows the Walker Cell, operating along the equator and about 300 miles on both sides of the equator. The Walker Cell moves air in the east/west direction. (If you recall the Hadley, Ferrel and Polar Cells move air primarily in the north/south direction. The Walker Cell overlaps the Hadley Cell with the two affecting 1/3 of the globe.) The Walker Cell Trade Winds pushes the surface water in the same direction of the wind. Because there is a land mass stopping the surface water current, there is a build-up (higher elevation) of water at one end of the ocean “bowl”. The build-up of water forces the deeper water to travel in the opposite direction, creating an opposite rotation of water flow as the air flow.
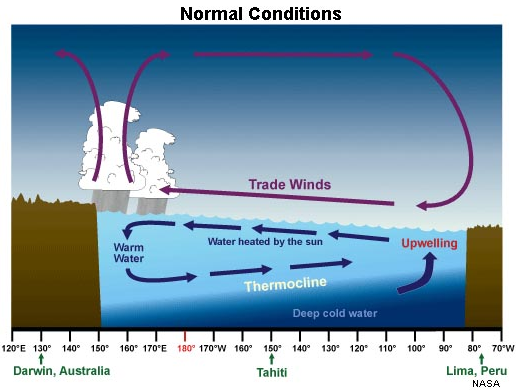 Figure 19. Walker Cell (East-West Currents)
Just like the Earth’s rotation moves air westerly around the globe, the oceans react the same way, as shown in Figure 20. The main difference is that the ocean currents are restricted by land masses. When the Panama isthmus was created by plate tectonics, the ocean current from the Atlantic to the Pacific was shut off. The red lines below represent warmer water; blue lines represent colder water.
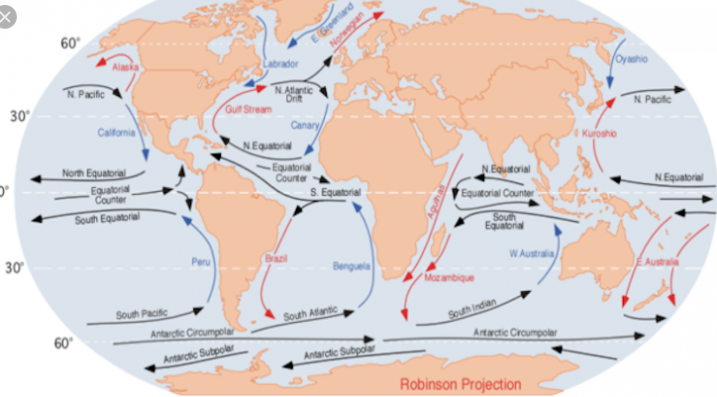 Figure 20. Ocean Currents
Figure 21. Depths of the Oceans and the Zones 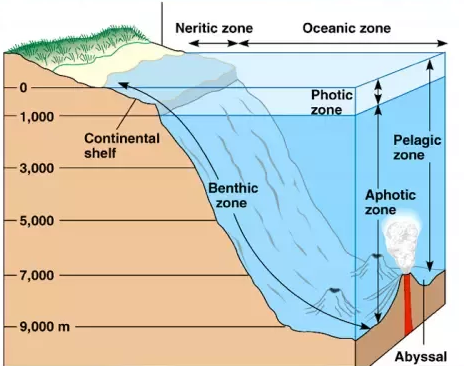
The Trade Winds and the ocean currents are not constant at or near the equator. Every 3 to 7 years the Walker Cell and the Trade Winds change intensity and even direction; this is called El Nino or La Nina. The broader term for this weather pattern is called the El Nino – Southern Oscillation (ENSO) cycle. The ENSO cycle is a scientific term that describes the normal fluctuations in temperature between the ocean and atmosphere in the east-central Equatorial Pacific. (Please note that the size of the ocean along the equator in the Pacific is three times longer than in the Atlantic Ocean. As such, an Atlantic ENSO has far less impact in the Atlantic than the Pacific ENSO cycle.) It happens naturally and has been doing it since man has been able to record the occurrence. There are three distinct phases: El Nino (the warm phase), the neutral phase (the average state of wind and ocean circulation patterns), and La Nina (the cold phase) as shown in Figure 22. Normally, El Nino or La Nina last 9 to 12 months but can last over a year or so. While what I discuss focuses on the Pacific Ocean from South America to Asia, ENSO can have broader weather effects across the globe.
Neutral Phase
During the neutral phase, depicted in Figure 23 and Figure 24 (a “normal” year), the western side of the Pacific Ocean experiences heavy rainfall and monsoons. The eastern side of the Pacific experiences dry conditions, even droughts. Trade Winds trying to equalize the air pressure differences push the upper level of the ocean westward. This raises the ocean level about a foot higher in the west than in the east. At the deepest levels, colder water is then forced eastward which then upwells trying to balance the difference in water height.
Please note the significant statement above. Man-made climate change believers claim that climate change caused by rising CO2 levels is causing the ocean levels to rise. Here is a case where the normal condition, Trade Winds, causes higher ocean levels in the west.
Figure 23. Neutral Phase – Simple View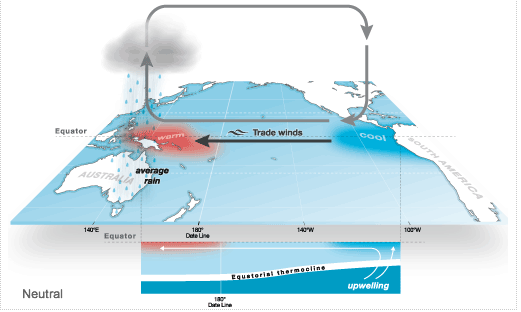
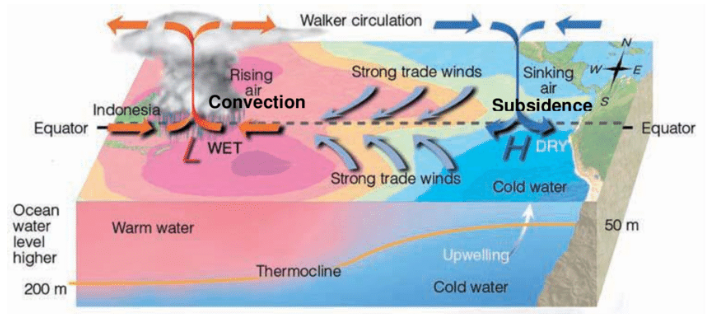
Figure 24. Neutral View – Expanded 3-D View
El Nino Phase
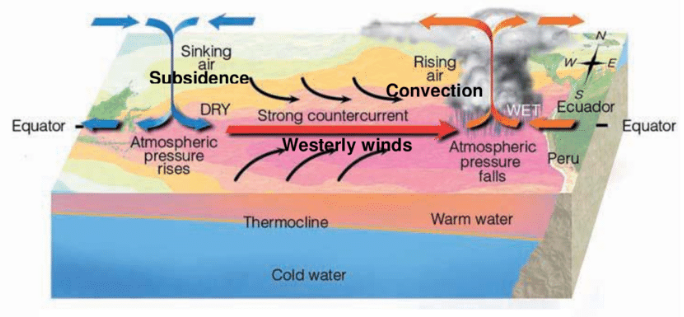
During El Nino, the weather pattern changes. As shown in Figure 25 and Figure 26, during an El Nino (warm phase), the air pressure patterns reverse with low pressure zones in the eastern Pacific bringing lots of rain and high-pressure zones in the western Pacific bringing drought conditions. The reversed air pressure zones diminish the normal Trade Winds and may even stop them or reverse them. The atmospheric Walker Cell flows counterclockwise (normally clockwise for the Neutral period). The ocean flow also reverses direction and flows clockwise (normally counterclockwise for the Neutral period). During an El Nino, the western Pacific is much drier. Conversely, the eastern Pacific is warm and wet. Please note the natural weather pattern shift (not climate change) that makes Australia dry as moisture moves eastward. As I write this, Australia is currently suffering from many raging forests fires due to extremely dry conditions. Contrary to what some Liberals are saying, these fires are not due to climate change. Weather variability caused the dry conditions but arsonists (24 in fact) started the fires. There are also 183 people suspected of lesser legal action.
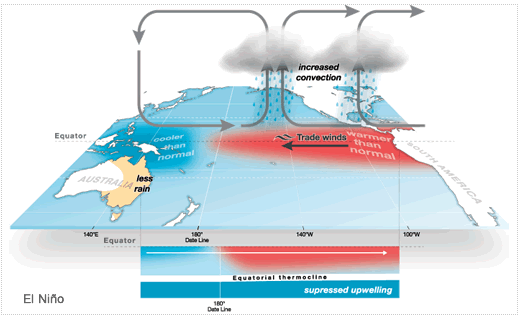 Figure 25. El Nino Phase – Simple View
La Nina Phase
During La Nina (cold phase), the wind and ocean currents are exaggerated from the normal (neutral) season cycle, shown in Figure 27. The Walker Cell flows clockwise again during La Nina, like the Neutral phase. Air pressure in the east becomes even higher than normal. Air pressure in the west becomes even lower than normal. The normal Trade Winds become much stronger. The normal upwelling in the ocean along the eastern side also becomes even stronger. As for the weather pattern during a La Nina, the eastern to central Pacific become cooler and drier. The western pacific gets much heavier rainfall and stronger monsoons. Regions that are typically dry during El Nino tend to become excessively wet during La Nina.
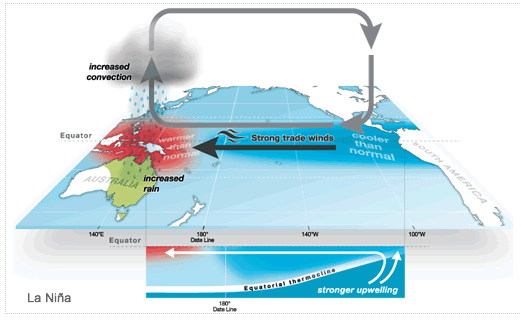 Figure 27. La Nina Phase – Simple View
Summary
What is the “take away” summary of this chapter? We learned that natural forces of nature following basic rules of physics and science create a pattern of wind and ocean currents that redistribute moisture and temperature around the globe. Not only does this help moderate Earth’s temperature differentials, but it brings rain to the lands. All of this happens naturally. However, as life giving as this can be, it can also create harsh conditions for life in some locations. Life in these areas had to adapt to these harsher conditions. Occasionally, these same natural forces create conditions that changes “normal” weather patterns. Since these are temporary conditions, they should not be considered as climate changes. They are merely normal weather patterns.
This chapter discussed two events that seem to change what most consider “normal weather”. Yearly Santa Ana winds reverse the normal wind patterns in California and bring extremely dry air with very strong winds. These conditions can turn a minor fire into a devastating raging inferno claiming lives and property. On a 3 to 7-year period, El Nino and La Nina can have drastic weather changes in the eastern and western Pacific regions of the globe. Just recently, El Nino created very dry conditions in Australia, which lead to devastating arsonist-caused fires. These weather events are normal weather and not climate changes.
Finally, this chapter addressed the very difficult subject of predicting clouds composition and the huge impact that it can have on any climate analysis. Two similar clouds that are identical other than the amount/type of aerosol component can have significantly different effects on global temperature. As per one quote from a climate scientist, “a 1% change in cloudiness count account for all 20th century warming.” Yet however, clouds are ignored in climate computer models.