Chapter 7 – The Difference Between “Weather” and “Climate”
By Michael Belsick
Weather is the normal pattern of hot/cold, wet/dry, and calm/windy that we are used to experiencing during the year and seasons. If it happens to be 1 degree warmer than what you remember, then you have not lived long enough to understand or appreciate normal weather variability. Climate is the general term used to describe the normal weather patterns, including minor extremes that may occur at regular intervals, during all seasons for a particular location and for a period of time of 30 years or more. In other words, a record setting warm day, a little less ice in the Arctic, the size of a glacier, one heavy rain fall causing flooding, or a more destructive hurricane than normal does not represent a climate change event. Minor weather changes from memory does not rise to the level of a climate change event unless it continues for 30 years or more. Here are some facts to counter the claims from anthropogenic climate change believers:
Temperature Increase
Man-made climate change believers tell us that the Earth is getting hotter. They blame man-made CO2 emissions increasing the greenhouse gases trapping more heat from escaping the Earth.
-
- From 1850 to 1940, the global average temperature rose by 1.04 degrees F when CO2 levels were lower than today.
- From 1940 to 1970, the temperature declined by 0.36 degrees F. (There was concern of a pending ice age.)
- From approximately 1975 to 1997, the average temperature increased by 0.72 degrees F.
- From 1997 to 2016, there has been no change at all in the global average temperature.
- As a recap, here are the average global temperatures in degrees F:
o 1850: 56.6 (beginning of the industrialized revolution)
o 1940: 57.64
o 1970/1975: 57.28
o 1997: 58.0
o 2016: 58.0
-
- 25% of human emitted CO2 occurred 1850-1940 with a global average temperature rise of 1.04 degree F
- 75% of human emitted CO2 occurred 1940-2016 with global average temperature rise of 0.36 degrees F
- 1/3 of human emitted CO2 occurred during 1997-2016 with NO temperature change
If you recall the graph of Earth temperature and CO2 concentrations, both have gone up and down for the past 800,000 years. The industrial revolution started, in only a few countries at first, in 1850. CO2 concentrations have been climbing steadily since then due to man-made production. However, if you look at the temperature data above, which is documented, global temperature rose by 1.04 degree F by 1940, but then declined by 0.36 degree F for the next 30 years as industrialization ramped up. After 166 years of industrialization, the average Earth temperature rose by only 1.4 degree F. If your household thermostat changed by 1.4 degree F, would you even notice it? Also, there is no absolute proof that increased CO2 caused this temperature rise. From 1940 to 1970, temperature dropped as CO2 increased. From 1997 to 2016 when more CO2 entered the atmosphere, there was no temperature change at all. How could anyone claim with certainty that CO2 concentrations drive temperature changes when the data does not support that?
Melting Ice Caps
Anthropogenic climate change believers are telling us that man-made climate change is melting the polar ice caps. The left picture in Figure 28 is the first satellite photo of the Arctic Ice Cap. It was taken in 1979 which happened to capture the Arctic Ice Cap at its peak. Clearly, in twenty years there is less Arctic Polar ice, shown in the photo on the right. What was the ice coverage before 1979? According to written documentation (ships logs instead of satellite imagery) there was less ice. Polar ice levels go up and down constantly. With CO2 levels rising since 1850, how is the increase of ice between 1940 and 1979 (shown in Figure 29) explained?
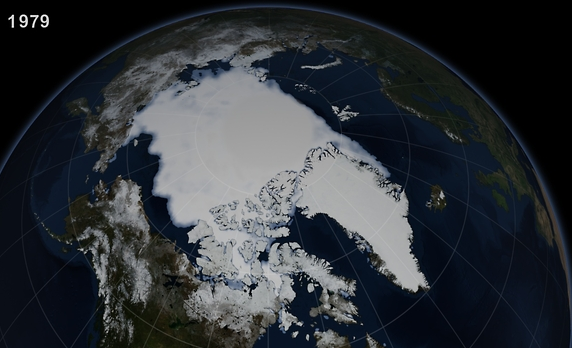
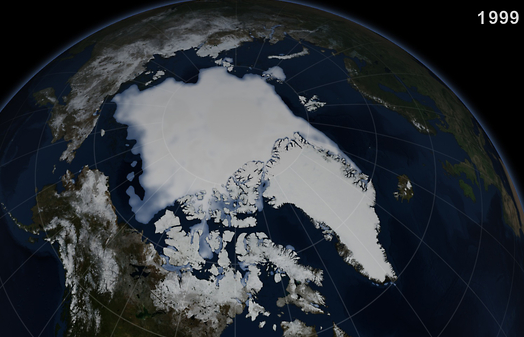 Figure 28. Northern Ice Cap
No one is offering a suggestion. Maybe there are more things going on that are unrelated to CO2 concentrations such as what was mentioned in Chapter 3 regarding the Milankovitch Cycles pushing warmer water into the Arctic in 2006.
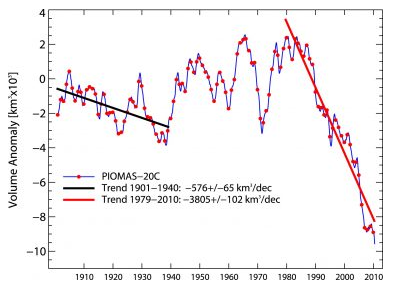 Figure 29. Polar Ice Caps
As an interesting footnote, when climate researchers sailed to Antarctica to measure the melting ice at the southern pole, their ship got stuck in the expanding ice fields in January 2014 (summer in the southern hemisphere). The researchers had to be rescued by a large plane that landed on the floating ice fields. While ice may (or may not be significantly changing) in the Arctic, ice has been increasing in the Antarctic for some time. How would worldwide global warming only affect the Arctic and not the Antarctic?
Glaciers
Like the disappearing polar ice in the Arctic, man-made climate change believers claim that glaciers across the world are diminishing due to man-made global warming. Figure 30 is the first ever photograph of the Lyell Glacier in 1883 and then again in 2013. Believers claim that this melting is due to man-made climate change. Conversely, geologists know that Yosemite Valley in California was carved out by eons of glacier activity. Scientists agree that almost all the glacier activity in Yosemite ended 10,000 years ago. So, massive glacier reduction 10,000 years ago was natural but minor glacier reduction is due to man? This seems farfetched.
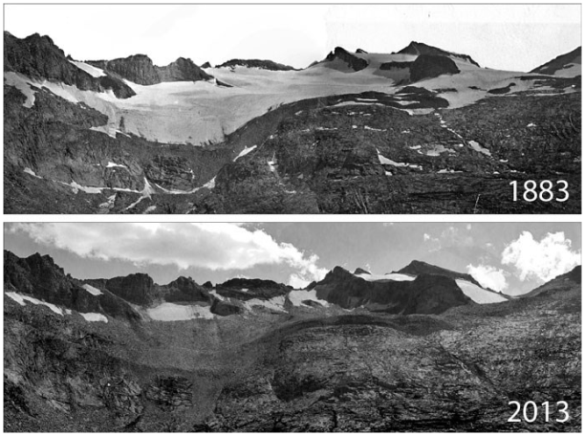 Figure 30. Lyell Glacier
Rain and Floods
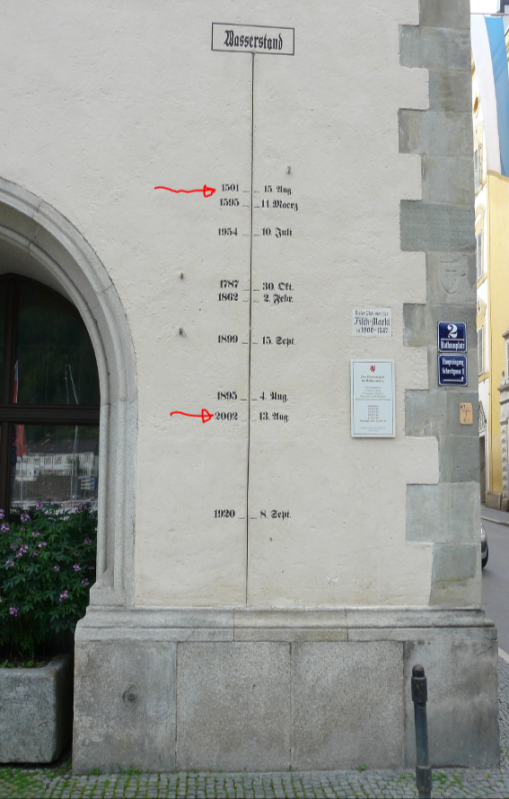
Figure 31. High Water Marks in Passau, Germany
Not only do man-made climate change believers tell us that we are creating deserts, but we are also flooding areas more than ever before. If one looks at any geological map around a known creek or river, you will find lines parallel to the water flow indicating the possible flooding that can occur within these bounds due to a “100-year flood”. Geologists know that any waterway can flood during highly unusual large rain totals. So, they indicate this info on geological survey maps. If someone builds a house within a 100-year flood plain, they really should not be surprised when their house is flooded even if they are not old enough to have ever seen a 100-year flood at this location.
Still, man-made climate change believers will tell you that recent higher levels of CO2 are increasing the threat of known floods. In Europe where stone buildings have lasted hundreds of years, it is easy to see the high-water marks on buildings near rivers. Sure enough, there is a stone building in Passau, Germany showing a high-level mark over 6 feet up from the ground indicating the “climate change” flood of 2002, shown in Figure 31. However, the flood of 1501 was about 5 feet higher than the one in 2002. How could man-made industrialization cause flooding in 1501? By the way, I took the photo when I was there on vacation earlier this year. As we traveled along the Danube River, there were plenty of other buildings showing the same thing.
Hurricanes
We are told that hurricanes are getting more frequent and more devastating. Sadly, most of the information online tells you how hurricanes are getting more destructive instead of telling you the raw facts about the number and category of hurricane strengths. With people building homes and businesses in locations frequently damaged by hurricanes and the fact that repair costs always go up, a criterion of “devastation” does not tell you if there are more hurricanes or stronger hurricanes than normal. If a bull escapes and breaks into a small-town grocery store doing $1000 worth of damage but then breaks into the store next store selling Waterford crystal doing $100,000 worth of damage, did the bull get bigger? The information shown in Figure 32 and Figure 33 provides the most honest answer to this question. (Sorry for charts not showing recent hurricanes. I had to go several pages deep in Google to find anything that did not only address hurricanes in terms of destructive costs.)
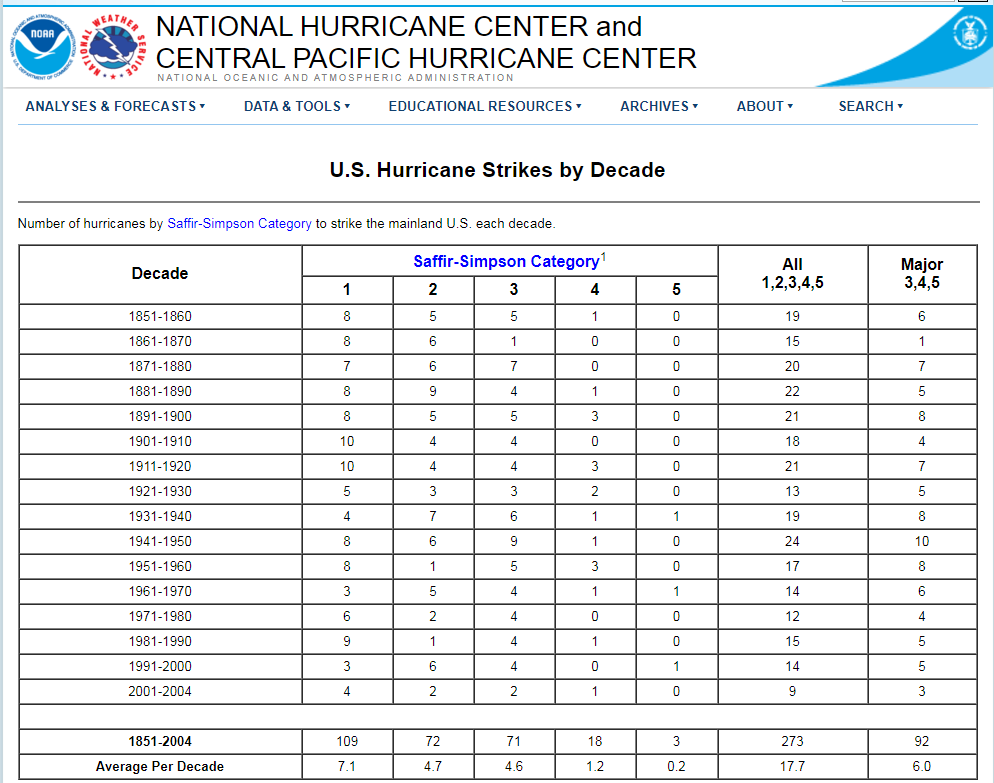 Figure 32. US Hurricane Strikes by Decade
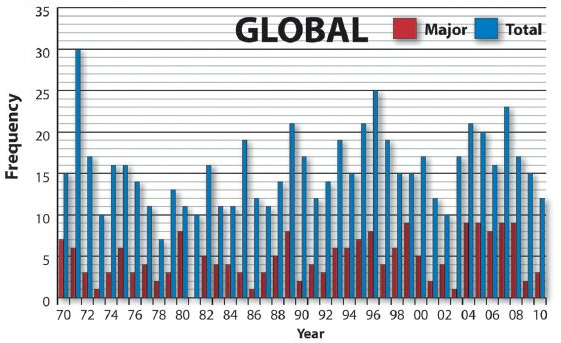 Figure 33. Global Hurricane Strikes
As one looks at the global and the US data, there is no significant increase in trend in the number of hurricanes or intensity during the time when man-made CO2 concentrations were on a constant rise. I don’t doubt that total hurricane damage is getting more expensive but it is due to cost reasons, not man-made higher levels of CO2 causing stronger hurricanes.
Tornados
Just like the total number and strength of hurricanes do not increase due to man-made climate change, US tornados have also not gotten any worse in recent years, as shown in Figure 34.
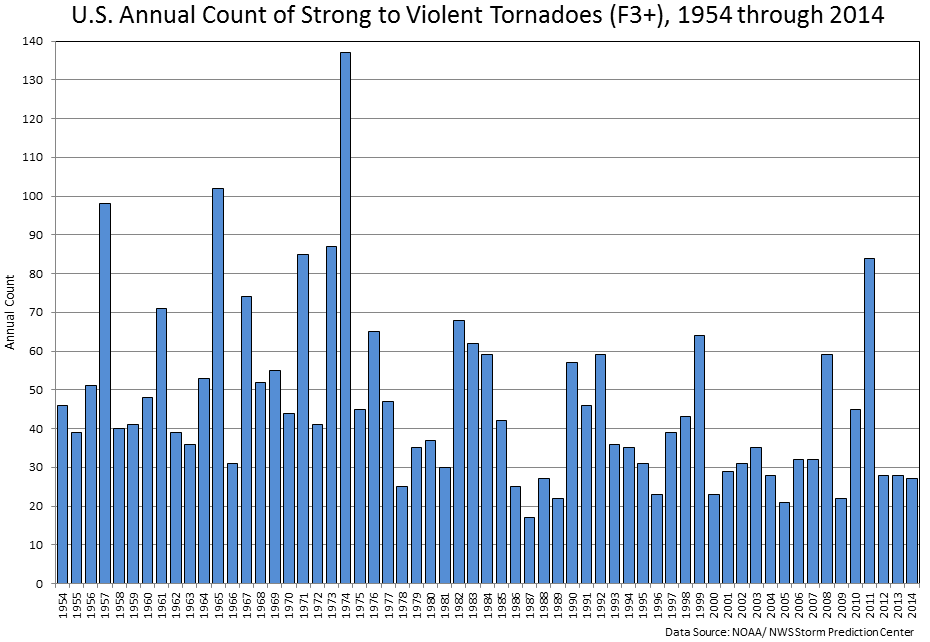 Figure 34. US Count of Strong to Violent Tornadoes (F3+), 1954 through 2014
Ocean Levels Rising
We are told that ocean levels will rise 4 feet within the next century. While anyone can predict anything that they want, current ocean levels are rising 1.4 millimeters per year (0.055 inches per year or 4.4 inches at the current rate after 80 years) as measured by satellites. At that rate, in 12 years when man-made climate change is supposedly irreversible and cataclysmic, the oceans will have risen 0.66 inches from today. That will hardly flood all of Florida or even come anywhere close to President Obama’s new ocean front home.
Summary
This chapter discussed claims of rising temperatures, melting ice caps (Arctic and Antarctic), river flooding and hurricanes that supposedly per man-made climate change believers are all getting much worse due to man-made CO2. Honest real data does not support any claim or possible future predictions.
-
- Since 1850, temperatures have gone up and down but only risen 1.4 degrees F total.
- Currently, Arctic ice is slowly melting but written records indicate that ice levels increase and decrease normally. As for the Antarctic, ice levels are building.
- Glaciers are slowly melting, but they have been doing this for thousands of years, which is long before man-made CO2 production.
- Flooding is a normal event. Comparatively, the Passau flood in the year 1501 was significantly worse than the most recent 2002 flood.
- There has been no observable increase of frequency or intensity of hurricanes since 1851. The cost of hurricane damage has been increasing but that is not due to man-made climate change.
- There have been no significant changes in quantity or severity of tornados.
- Ocean levels are currently rising 0.055 inches per year. That is hardly going to flood any coastal population in the near term.